

Dashboard Overview
Navigate the SealGate dashboard and understand its main features.
The dashboard is your command center for monitoring and controlling AI activity across your organization.
Layout
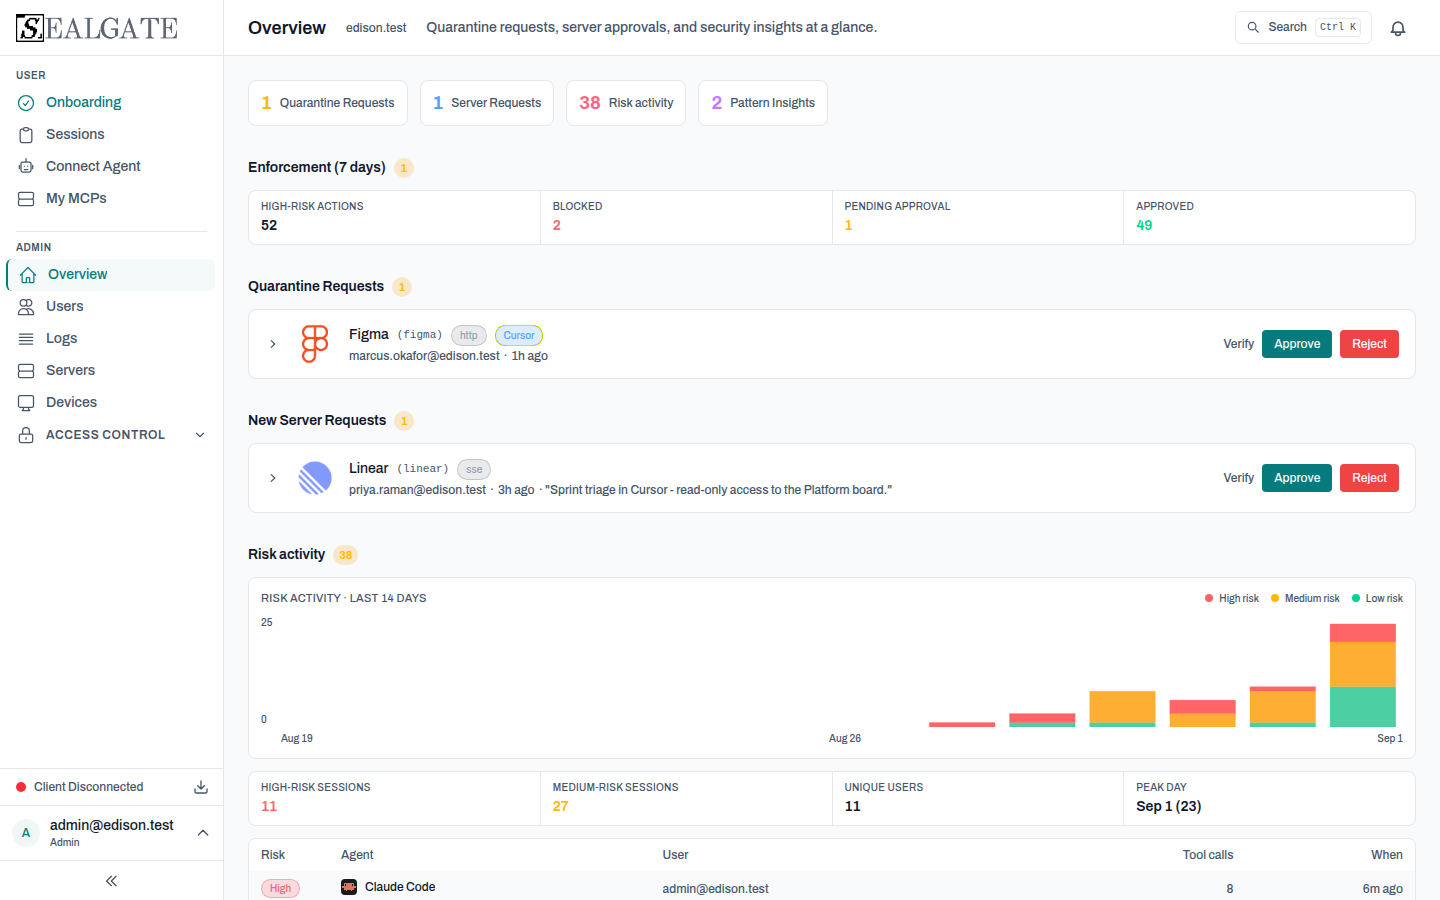
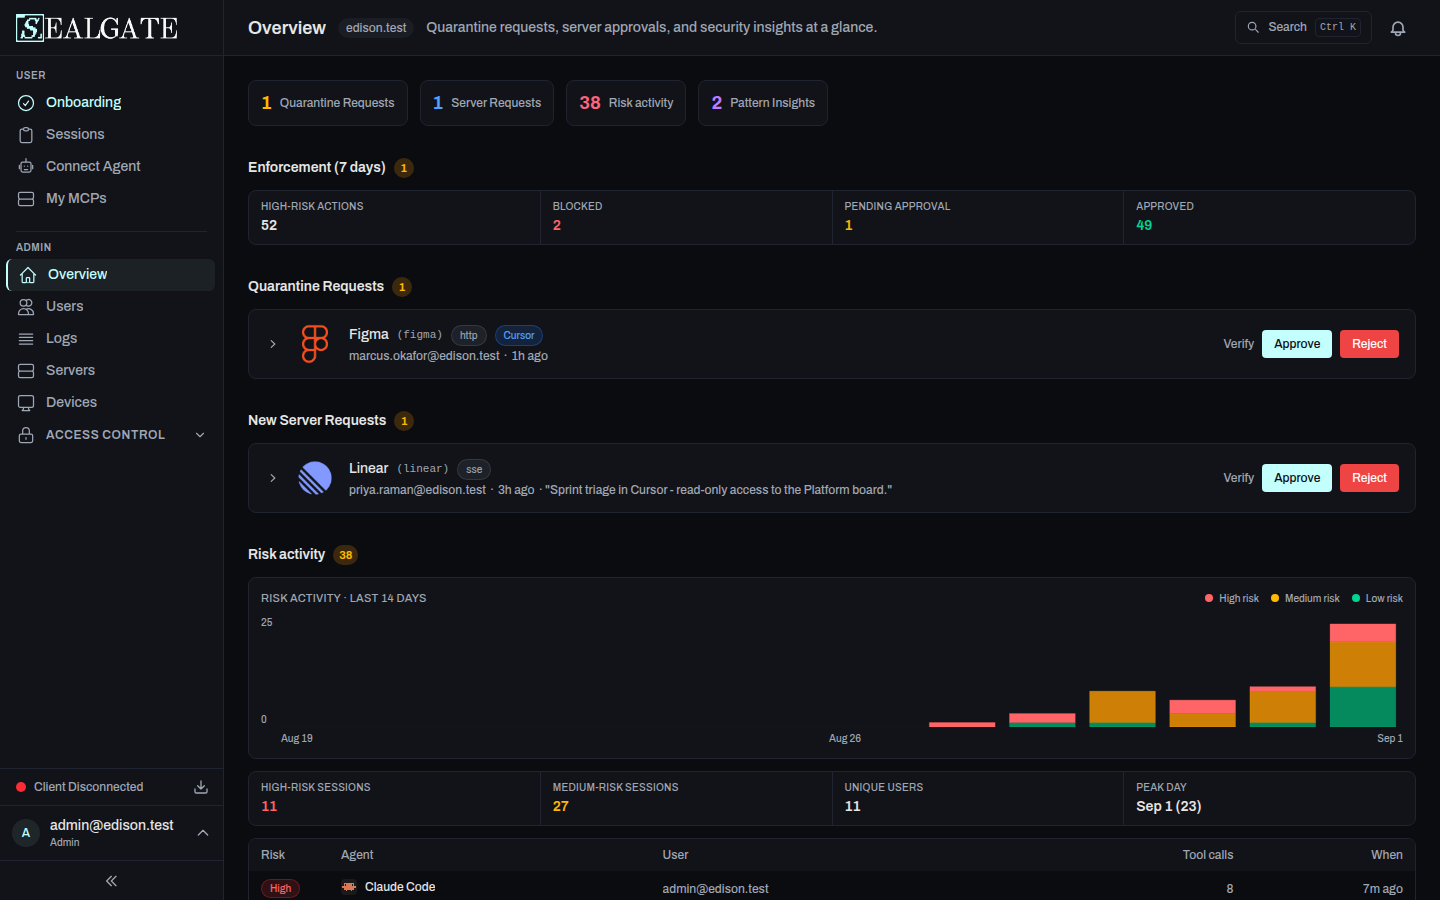
The dashboard uses a sidebar on the left for navigation and a main content area on the right.
Sidebar Navigation
The sidebar is grouped into sections based on your role:
| Section | Visibility | Entries |
|---|---|---|
| User | All users | Sessions, Connect Agent, My Connectors |
| Admin | Admins | Overview, Users, Manage Connectors, Devices, Access Control (expands to Guardrails, Policies, Roles, Permissions), Observability (expands to Logs) |
The Observability → Logs entry links to your organization's audit trail of configuration and security changes.
Settings is not a sidebar entry - open it from the user-menu dropdown at the bottom of the sidebar (along with Sign Out and theme controls).
Header
Most pages show a Docs link in the header (book icon) that opens the documentation for that page.
Sessions View
The Sessions view at /dashboard/sessions is the default landing page after sign-in and the primary monitoring interface for all users.
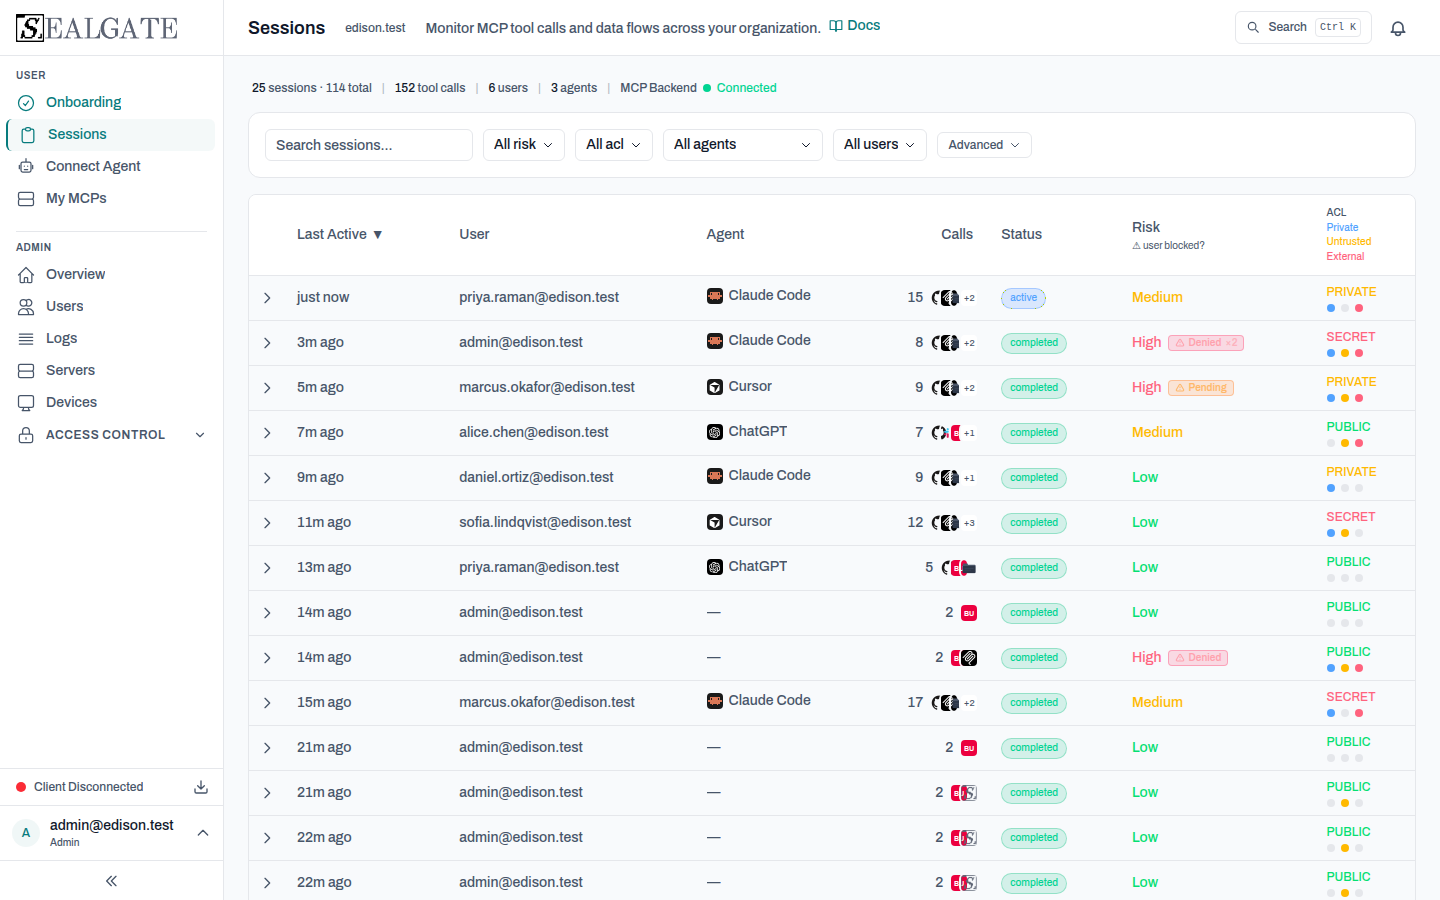
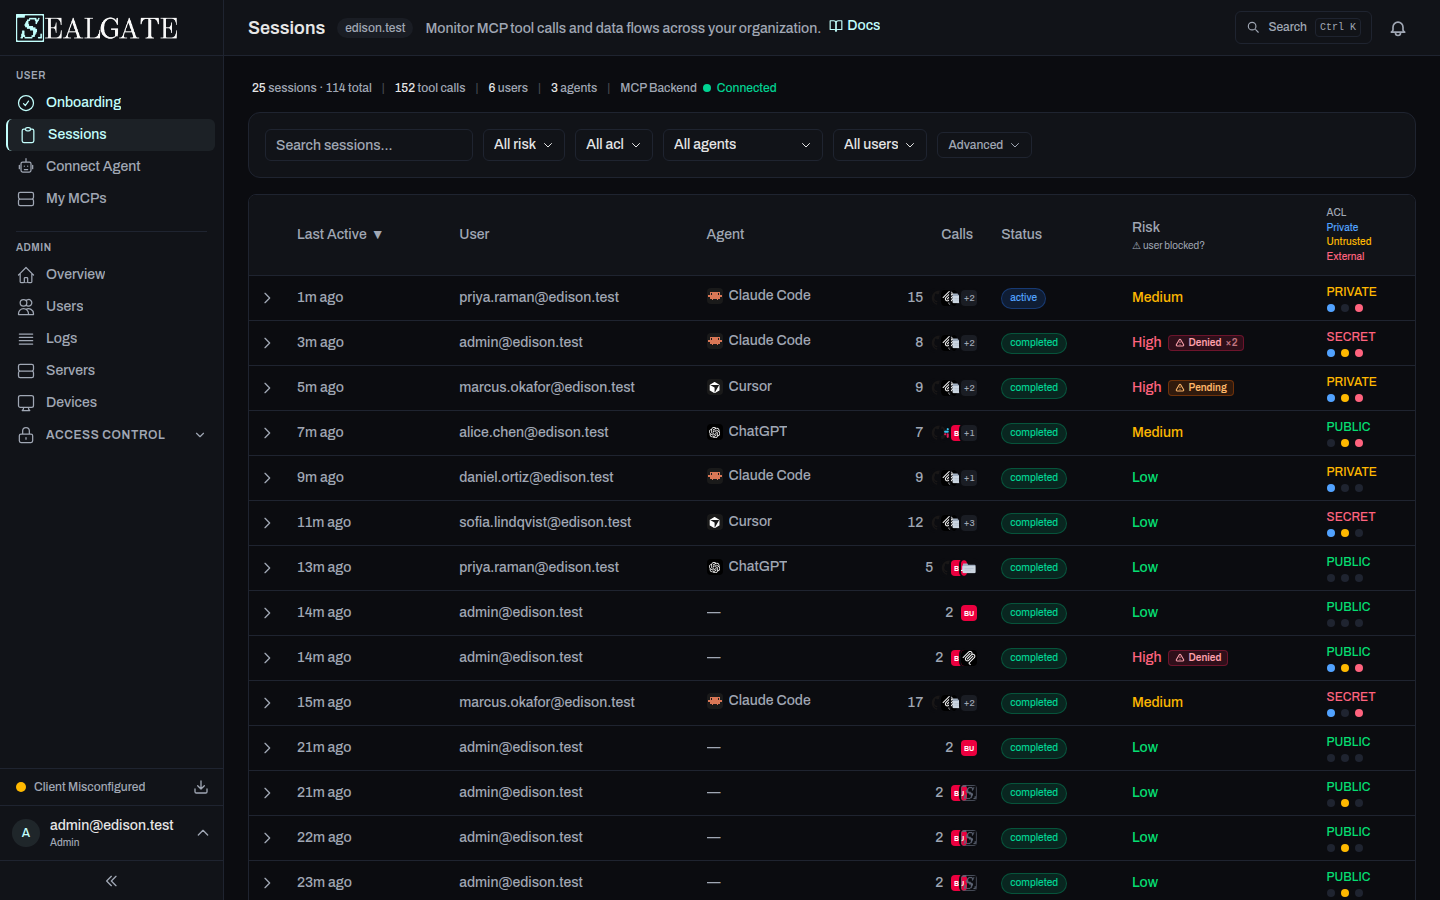
Each row in the sessions table shows:
| Column | Description |
|---|---|
| Last Active | When the session last had activity. |
| User | The person who started the session. |
| Agent | The AI agent (e.g. Claude, Cursor). |
| Calls | Total tool calls in the session. |
| Status | Active, completed, or blocked. |
| Risk | Low (green), Medium (amber), or High (red). |
| ACL | Highest sensitivity level accessed. |
| P/U/E | Colored dots: Private (blue), Untrusted (amber), External (red). |
Click any row to expand the full tool call timeline.
Overview Page (Admins)
The Overview page (/dashboard/overview) is the admin dashboard. It shows:
- Pending server requests - users requesting access to new MCP servers.
- Pending quarantine requests - servers blocked by the client app awaiting approval.
- Security insights - recent policy violations and risk patterns.
Understanding Security Flags
SealGate tracks three data-flow flags per session:
| Flag | Dot | Triggered by |
|---|---|---|
| Private data | Blue | Reading files, databases, or internal documents. |
| Untrusted content | Amber | Fetching web content or calling external APIs. |
| External comm | Red | Sending emails, Slack messages, or external API calls. |
A session with all three flags set is a Trifecta - the highest-risk combination. Use the Trifecta filter on the Sessions page to find these sessions.
Risk Levels
| Level | Flags | Indicator |
|---|---|---|
| Low | No External Communication flag, or External Communication on its own | Green |
| Medium | External Communication plus either Private Data or Untrusted Content | Amber |
| High | All three flags (the Trifecta) | Red |
ACL Levels
| Level | Meaning |
|---|---|
| PUBLIC | No sensitive data accessed. |
| PRIVATE | Internal/confidential data accessed. |
| SECRET | Highly sensitive data accessed. |
Tip: Use the date range filter and security flag filters together on the Sessions page to investigate specific incidents.